Local AI on a 32 GB M1 Pro: fitting the model is only the start
A 32 GB MacBook Pro can run surprisingly large local AI models. But fitting a model into memory is only half the story. In our tests, some long-context setups took several minutes before they even started answering.
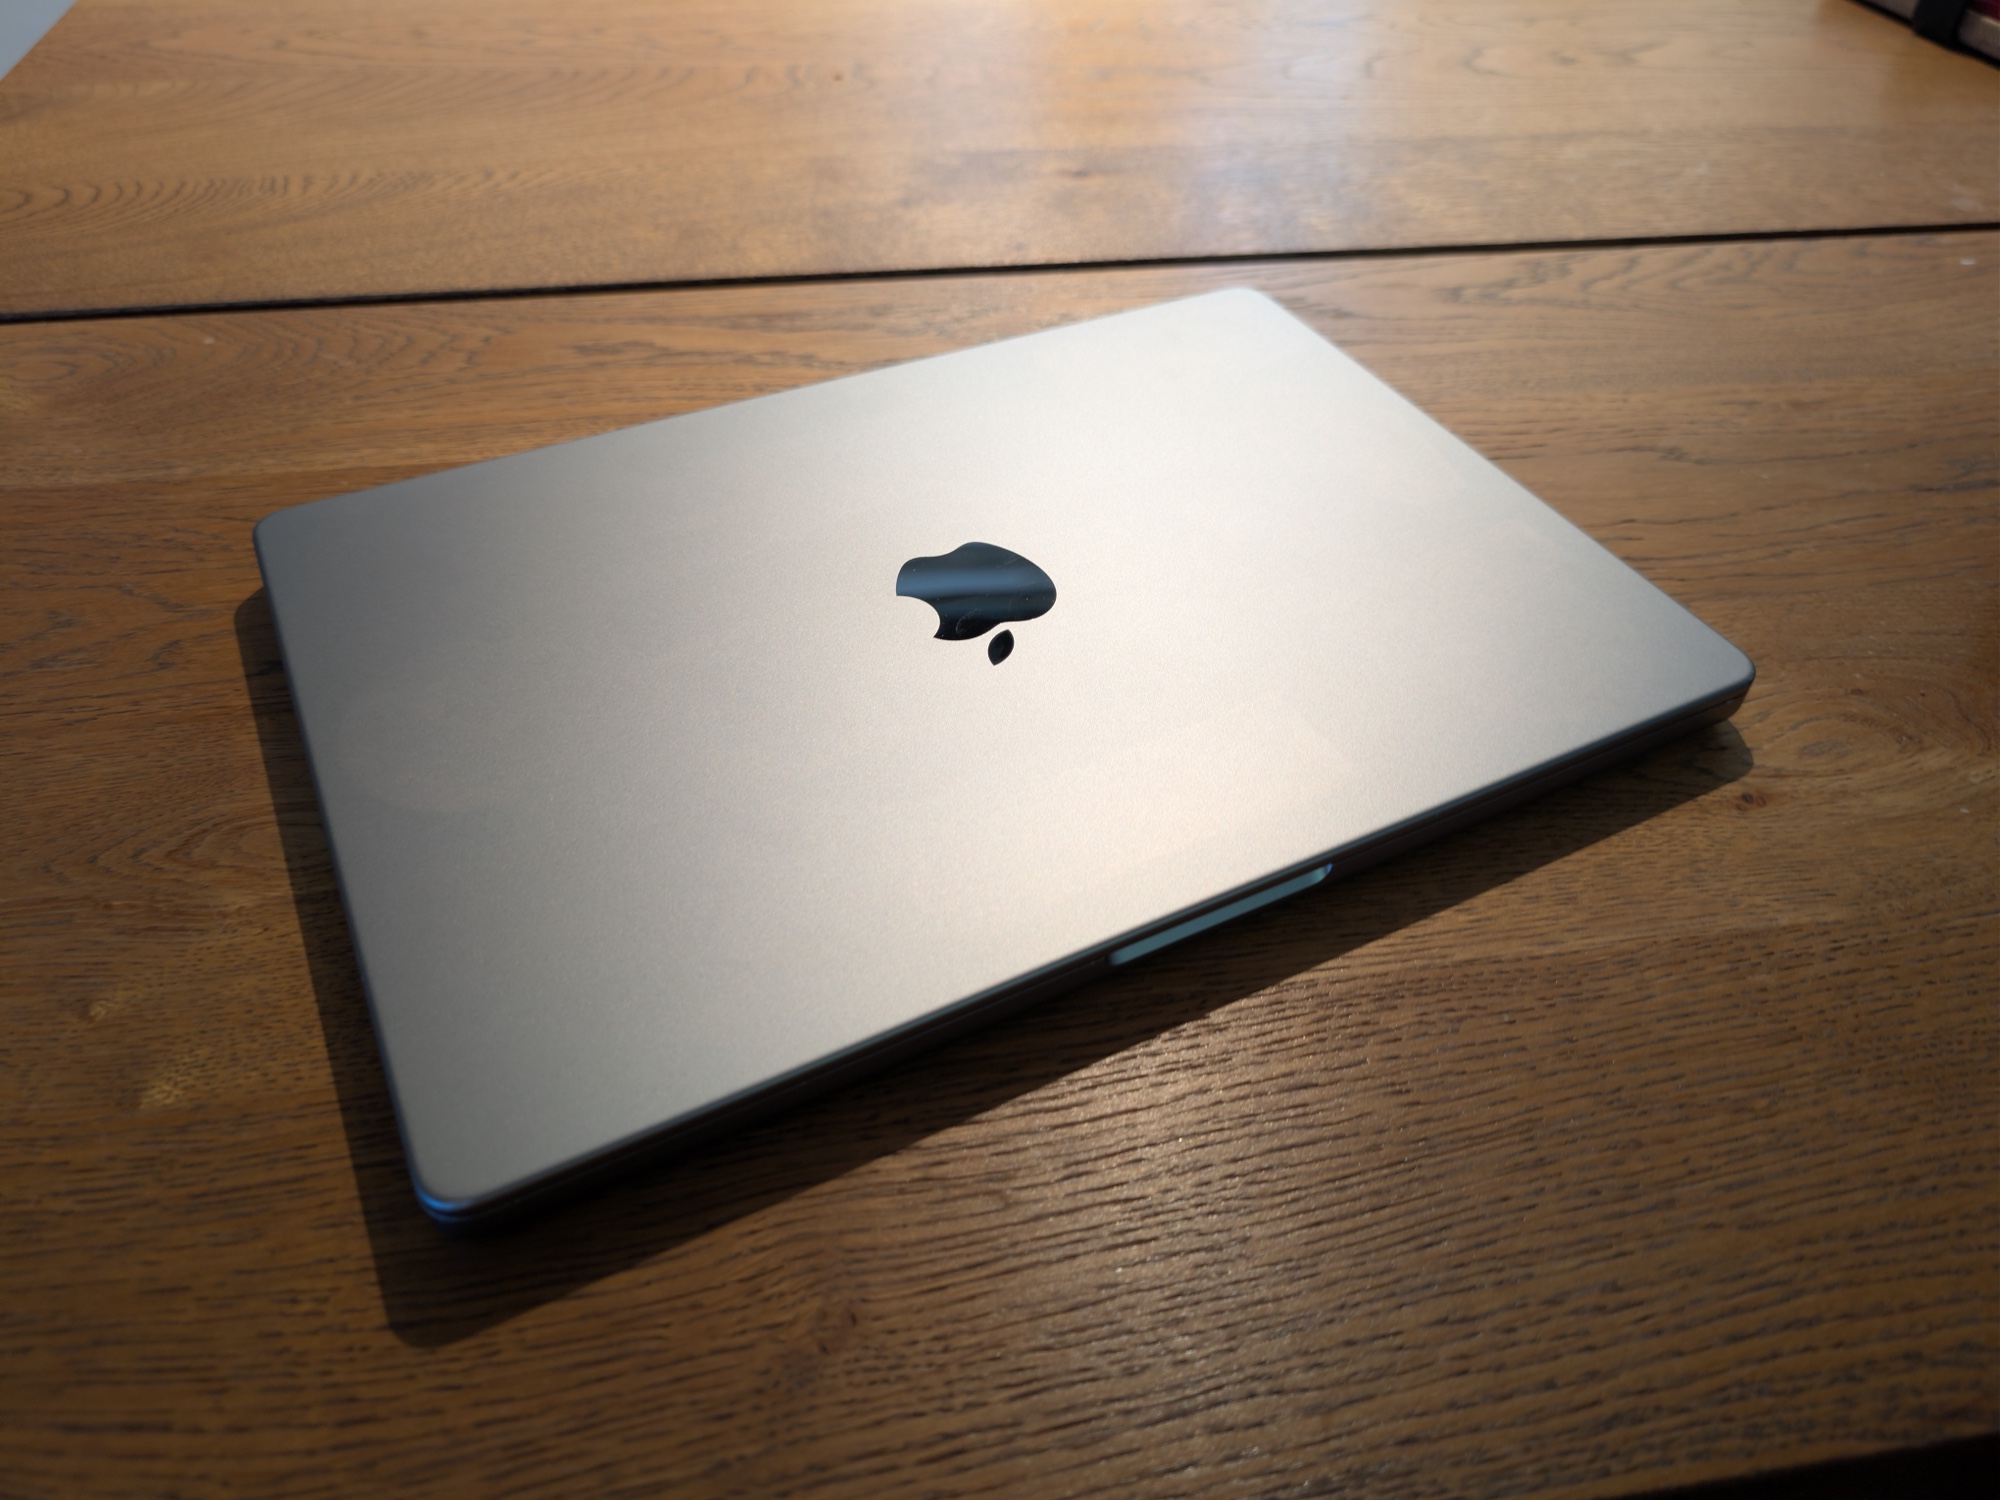
If you are choosing hardware for local AI, the usual question is: Will the model fit?
That turned out to be an incomplete question. We tested Qwen2.5 models from 3B to 32B on a MacBook Pro with an M1 Pro and 32 GB of unified memory. Several pinned setups completed without observed swap, but long prompts could still take minutes before the model began to answer.
We also saw a larger, more-compressed setup pass more diagnostic tasks than a smaller, higher-precision one. Both model size and quantization changed in that comparison, so it does not tell us which change caused the difference.
The useful question is not only what the Mac can run, but which setups are practical for the task and wait involved.
With a short prompt, these same setups began in about 0.9–1.8 seconds. With a prompt of roughly 30,700 tokens, the wait was 3 min 37 sec to 7 min 53 sec. This is the time to first token (TTFT): how long you wait before the model starts its answer, not the time to finish it.
How long before the model starts answering?
Bars use a linear scale from 0 to 8 minutes. With compact prompts, all three setups began in under two seconds.
- 7B Q4, 32K context3 min 37 sec
- 14B Q4, 32K context, q8 KV7 min 52 sec
- 14B Q4, 32K context7 min 53 sec
The full comparison
The detailed figure below includes all 13 configurations and preserves the final cell with its interaction notes. Compact inputs held about 210–225 tokens; full inputs held about 2,040 tokens in 4K cells and about 30,700 in 32K cells.
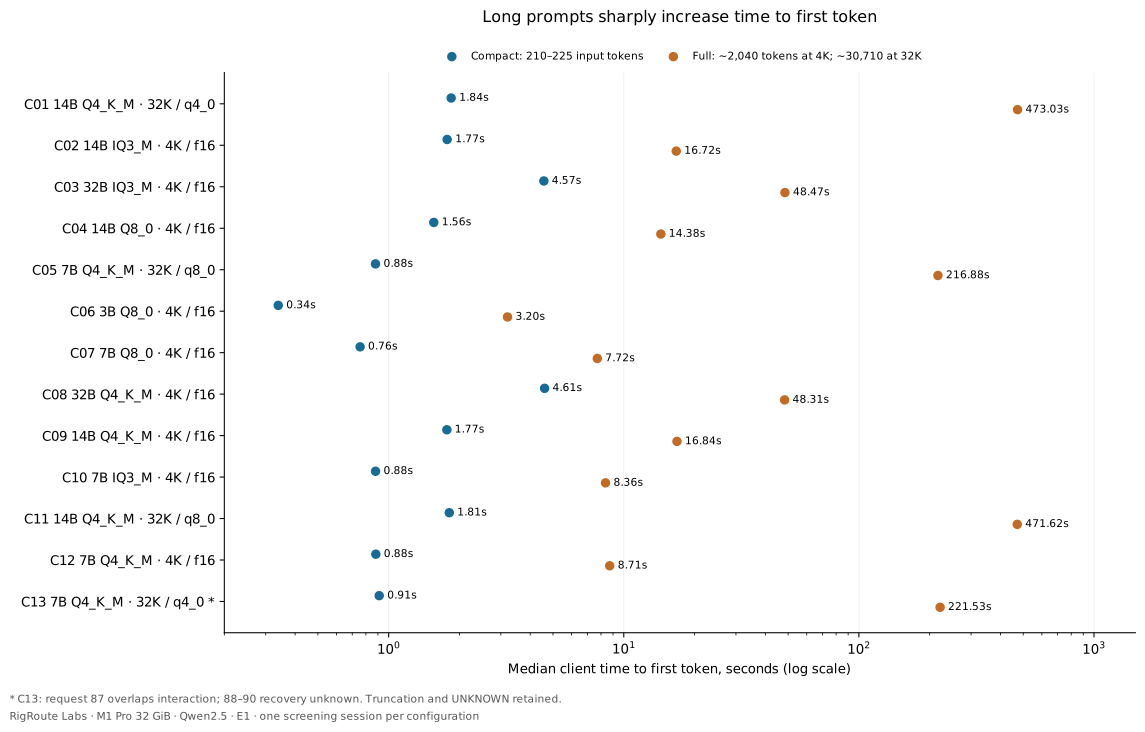
Long prompts change the wait dramatically
The three selected 32K runs show a similar pattern: compact prompts began in 0.879–1.844 seconds, while full prompts took 216.882–473.025 seconds to produce the first token. That is about 247–260 times longer, comparing the condition medians. The benchmark did not measure how long a complete answer took.
| Model / KV | Short-prompt TTFT | Full-prompt TTFT | Full prompt | Full generation | Full P/F/U |
|---|---|---|---|---|---|
| 14B Q4_K_M / q4_0 | 1.844 s | 473.025 s | 64.90 tok/s | 5.62 tok/s | 14 / 4 / 0 |
| 7B Q4_K_M / q8_0 | 0.879 s | 216.882 s | 141.52 tok/s | 12.78 tok/s | 1 / 17 / 0 |
| 14B Q4_K_M / q8_0 | 1.811 s | 471.615 s | 65.10 tok/s | 5.74 tok/s | 16 / 2 / 0 |
For the 14B/q8_0 KV setup, generation ran at 11.69 tok/s after a short prompt and 5.74 tok/s after a full prompt. For 7B/q8_0 KV, it was 23.65 and 12.78 tok/s. Long prompts affected both the wait to start and the pace once generation began.
These requests reused no KV-cache tokens. The study did not clear or measure the operating system’s disk cache, and it did not test a retrieval pipeline. A shorter prompt reached the first token sooner here; we did not test whether an automatic retriever would keep the facts a task needs.
No observed swap did not mean no waiting
Across 318,240 model-telemetry samples, recorded memory pressure was normal. Maximum reported swap use was zero, and swap-in and swap-out counters did not increase within any cell. The host memory compressor was active.
These measurements do not account for all unified GPU/model allocation or available headroom. We know the GGUF file sizes, but not the complete runtime footprint. The result is narrower: no swapping was observed in the sampled periods. Spare memory and the cost of memory management were not measured.
What smaller files did, and did not, buy
At 4K/f16, 32B IQ3 passed 24 of 36 diagnostic tasks; 14B Q8 passed 17. The 32B IQ3 file was smaller (13.793 GiB versus 14.623 GiB), but generated more slowly (6.65 versus 10.96 tok/s). This compares two complete configurations: model size and quantization both changed, so it isolates neither cause.
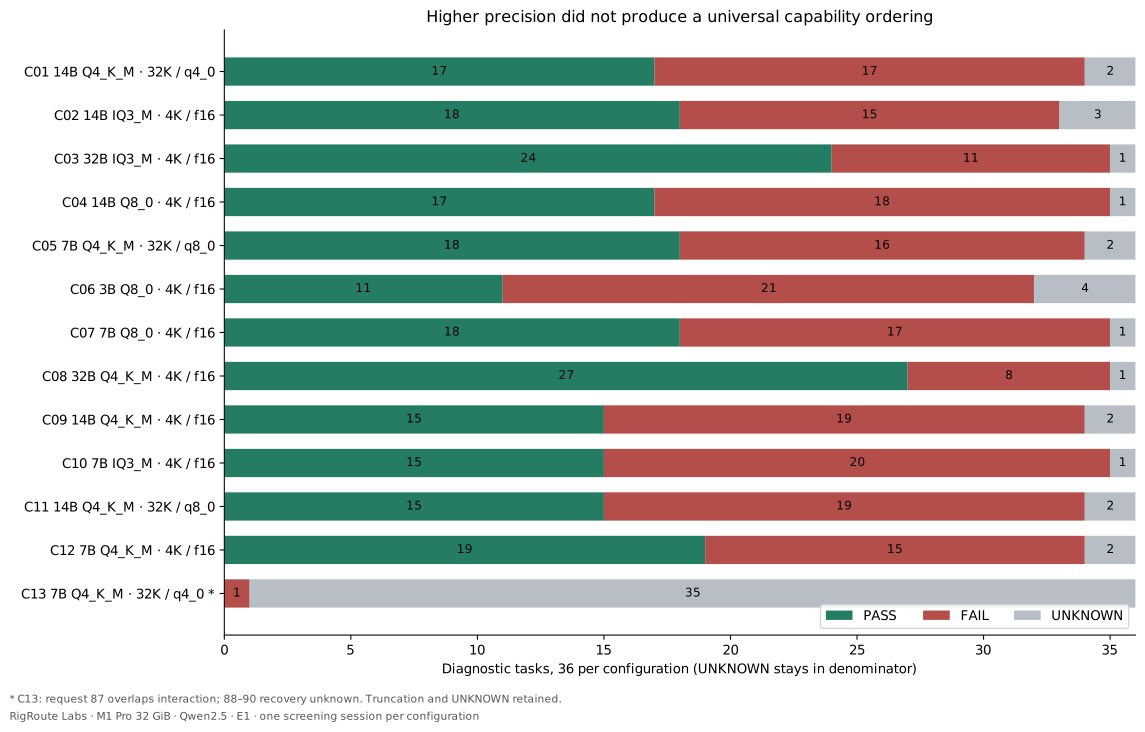
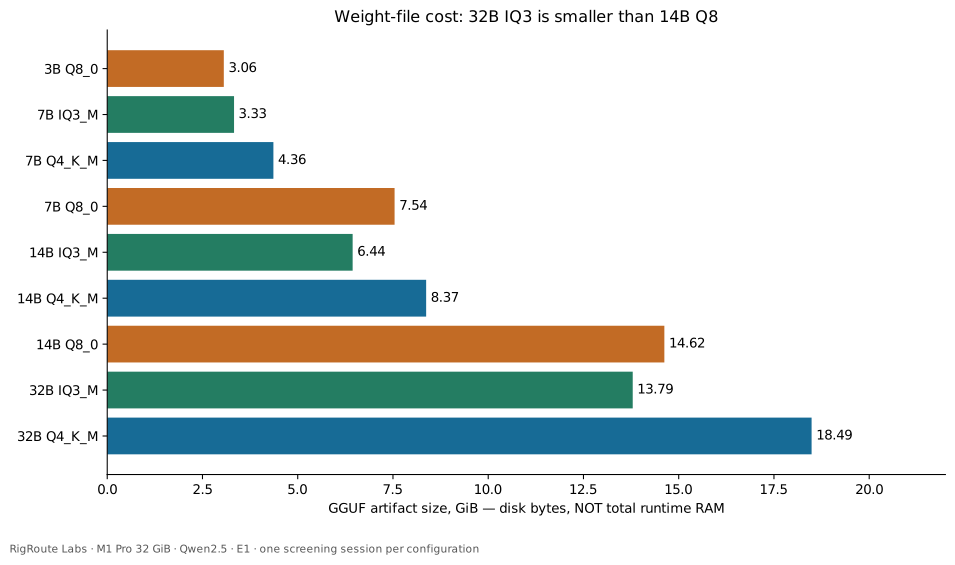
Quantization did not produce one consistent ranking. At 7B, Q4 passed 19 diagnostics, IQ3 passed 15 and Q8 passed 18. IQ3 saved 1.033 GiB versus Q4 and generated 6.6% faster, with four fewer passes. At 14B, IQ3 passed 18, Q8 passed 17 and Q4 passed 15. At 32B, Q4 passed 27, three more than IQ3, while its file was 4.695 GiB larger and generation was slower.
These small count differences come from one 36-task screening set. They do not show that IQ3 improves reasoning, equals Q8, or that Q4 is always best. Q8 processed short prompts faster in some matched comparisons. IQ3 used fewer file bytes and sometimes generated faster. The result depended on model size and task.
A 14B middle ground, with a task-specific caveat
For this task mix, 14B IQ3/4K/f16 is a provisional balanced candidate. Its weight file was 6.442 GiB; it reached 14.70 diagnostic tok/s and passed 18/36 diagnostic tasks. It passed 18/18 full-evidence tasks at roughly 2K input tokens. Median time to first token was 1.773 seconds for compact prompts and 16.718 seconds for full prompts.
7B Q4 was faster at 25.46 tok/s and passed one more diagnostic (19/36), but passed 8/18 full-evidence tasks. That is why 14B IQ3 is a candidate for balance here, not a winner for every workload.
For short tasks with answers you can check, 3B Q8 was the smallest and fastest tested option: 3.060 GiB on disk, 45.36 diagnostic tok/s and 0.339-second compact-prompt TTFT. It passed 11/36 diagnostics. 32B Q4 led the matrix at 27/36, with 5.69 tok/s and a 4.605-second compact-prompt TTFT. Its extra task passes may not be worth the wait for every use.
At 32K, 7B Q4 with q8_0 KV passed 1/18 full-evidence tasks after a 216.882-second wait. 14B Q4 with the same KV setting passed 16/18 after 471.615 seconds. A context setting controls how much text the runtime accepts; it does not prove that all of that text is useful evidence.
What the KV-cache comparison cannot tell us
At 14B Q4 and 32K, q4_0 and q8_0 KV had similar full-prompt waits: 473.025 and 471.615 seconds. The q8_0 cell passed 16/18 full tasks; q4_0 passed 14/18. Sampled process-footprint peaks were 3.350 GiB with q8_0 and 1.848 GiB with q4_0, but those readings do not capture total unified GPU allocation or isolate KV bytes. We did not test 32K with f16 KV, so the largest useful context extension remains unknown.
One result needs a separate warning. 7B Q4 at 32K/q4_0 produced repetitive, unusable output from its first diagnostic requests. All 36 diagnostics occurred before VS Code opened; the grader recorded 0 PASS, 1 FAIL and 35 UNKNOWN. The later interaction therefore does not explain that initial anomaly. The cause remains unknown, and this one cell does not establish a general q4_0 KV failure.
What we tested, and what E1 means
We used a pinned Metal build of llama.cpp, build 11146 at source commit 7fe450e19, on one Apple M1 Pro with 32 GiB unified memory. The matrix covers Qwen2.5 Instruct models in 3B, 7B, 14B and 32B classes, with IQ3_M, Q4_K_M or Q8_0 weights. Nine configurations used 4K/f16 KV. Four used 32K with Q4 weights and q4_0 or q8_0 KV. The exact matrix and identifiers are linked below.
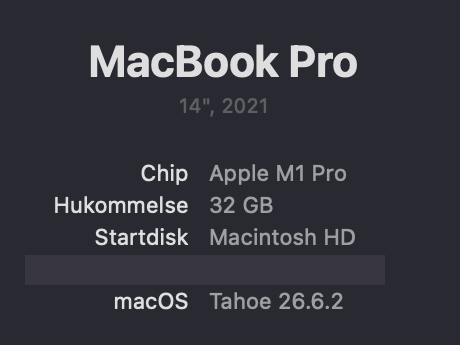
Each configuration used 36 synthetic diagnostic tasks and 54 synthetic context requests covering full, compact and missing evidence. Each had one session. Evidence level E1 means an exploratory result from a controlled screening on one machine; it has not been independently replicated. There is no confidence interval. Results do not automatically transfer to another Mac, AMD or NVIDIA hardware, or a developer machine running other applications.
In the last configuration, requests 1–86 finished before VS Code opened. Request 87 overlapped confirmed VS Code presence. Requests 88–90 remain unknown because the process exit was not recorded. All 36 diagnostics preceded the launch. The late requests remain in the detailed data with separate flags and do not drive the headline. An earlier partial attempt at the 7B IQ3 configuration is preserved separately; its responses are not pooled with the completed run.
Here, “can run” means the exact pinned execution completed. “Useful” depends on the task results and how long you are willing to wait. “Balanced” is an editorial description for this task mix, not a preset threshold or a general buying recommendation.
Results and source files
The public files contain derived tables and figure data. They exclude raw prompt and response journals, model files, local filesystem paths and host clock traces.
- Full results report (Markdown)
- Complete readable result matrix (Markdown)
- Configuration results (CSV)
- Structured configuration results (JSON)
- Derived task outcomes (CSV)
- Claims and limitations (Markdown)
- Stage 1A protocol summary (reproducibility reference)
- Labs methodology overview (The standard-ai-v0.1 overview describes a different benchmark; the Stage 1A protocol is linked above.)
- Tested Apple M1 Pro system
Technical figures
- Generation throughput figure (SVG)
- Prompt processing figure (SVG)
- Speed and diagnostic outcomes figure (SVG)
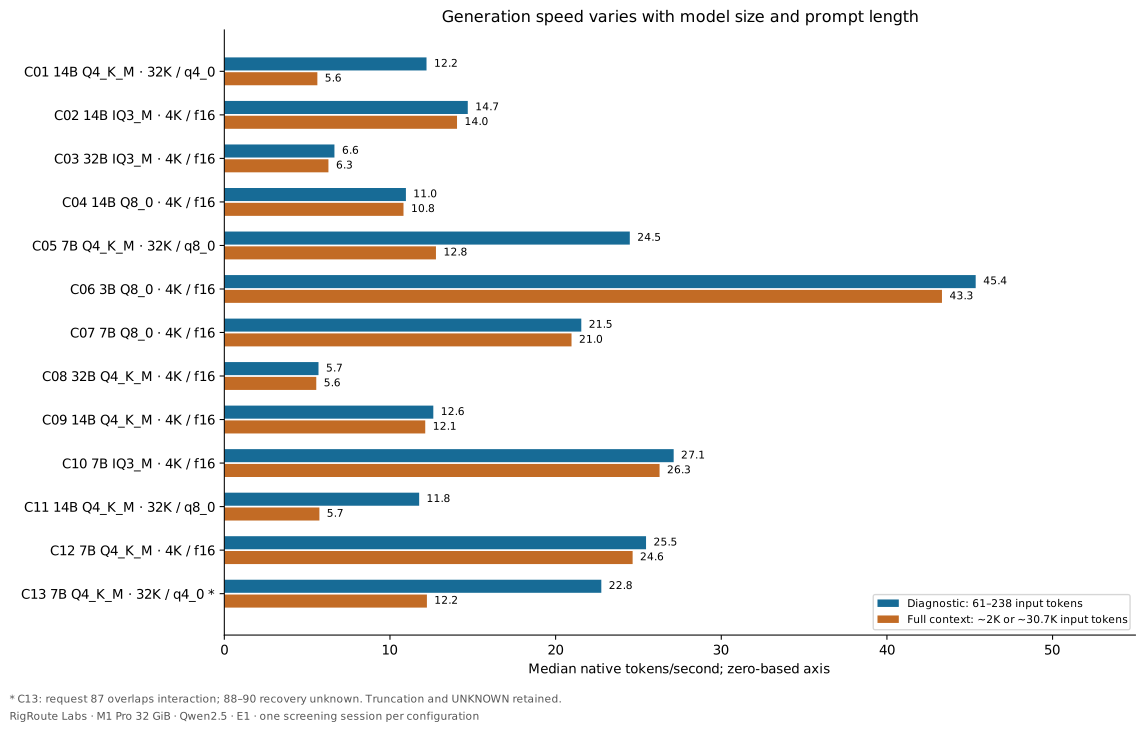
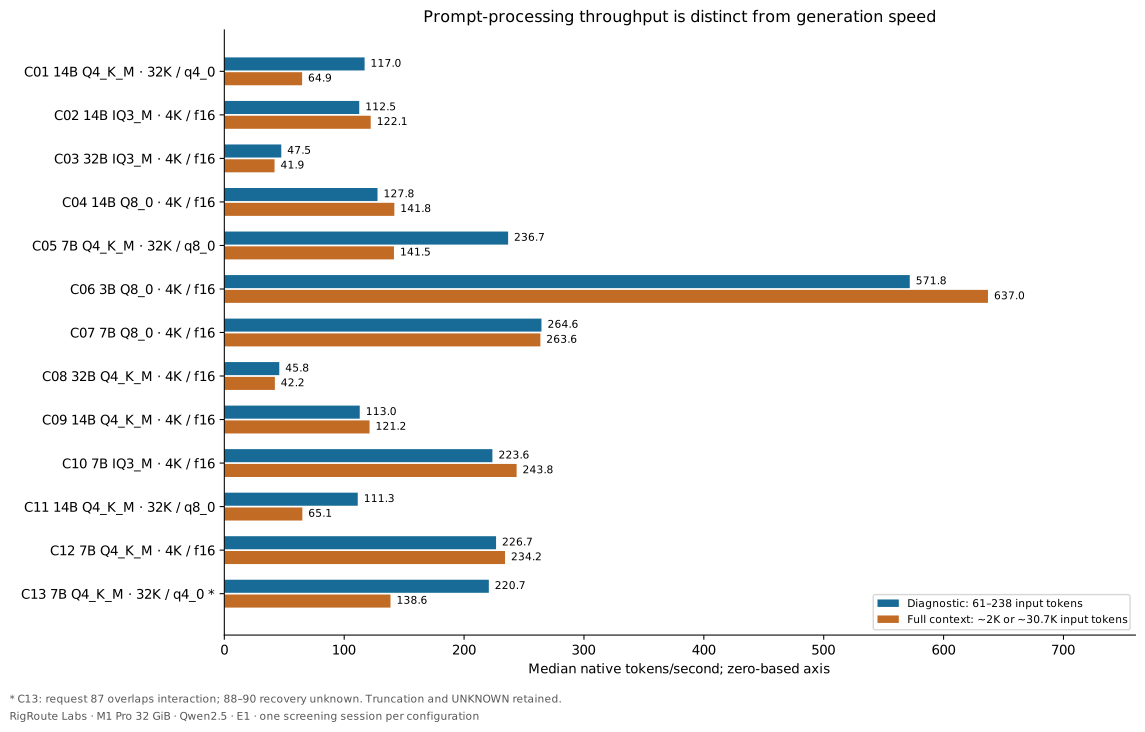
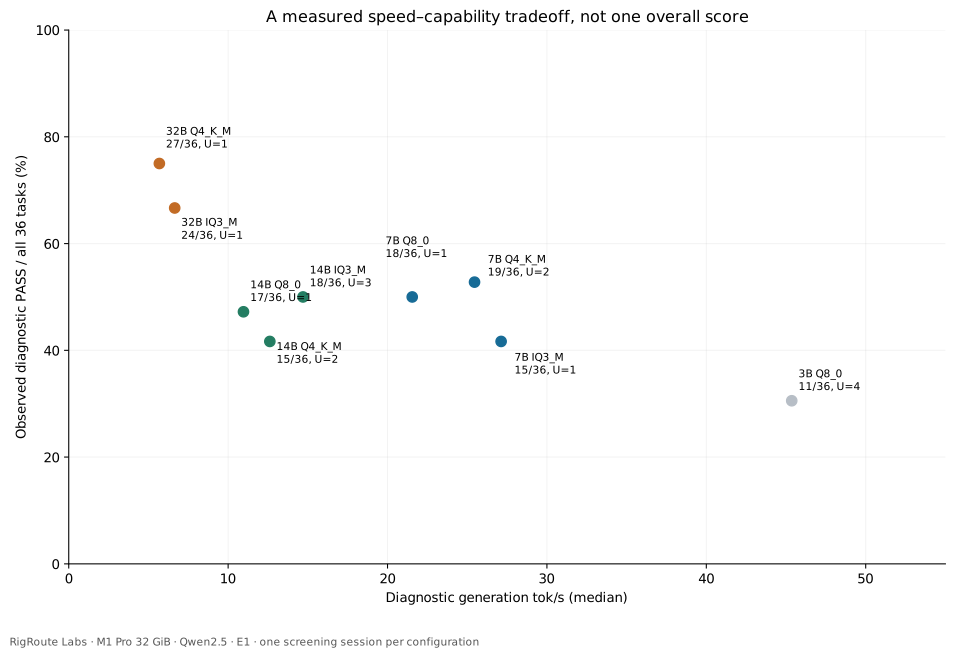
The six figures are descriptive views of this screening. Their axes and included cells are listed in the figure manifest. The figure manifest.
Methodology and audit references retain the internal study identifier.